Intro
To be completely honest, I'm writing this bit reluctantly, as I do not 100% understand this monitoring setup, especially how each component is interconnected. So, there might be inaccuracy, or unnecessary setup. If you have more knowledge about this, please correct me in the comments and I will fix it. However, in the end you will have working monitoring using Prometheus and cool looking dashboards using Grafana. Hopefully also some understanding of how things work. The method of deployment I have chosen is not the easiest, but it allows more control over what’s going to be deployed.
I like Helm, but running something like helm install Prometheus will deploy a full stack of monitoring, sprawling over the whole cluster, deploying tons of services and permissions left and right, multiple instances and so on... (I'm sure that can be set up to your liking, but I guarantee that you will not know how the monitoring works. What is sending what and where...)
What ?
I'm going to deploy Prometheus to collect data from various services in my K3s Kubernetes cluster. In this guide, I assume the same settings and services as I have, mainly Longhorn for persistent storage. Data from Prometheus will be displayed in a single instance of Grafana.
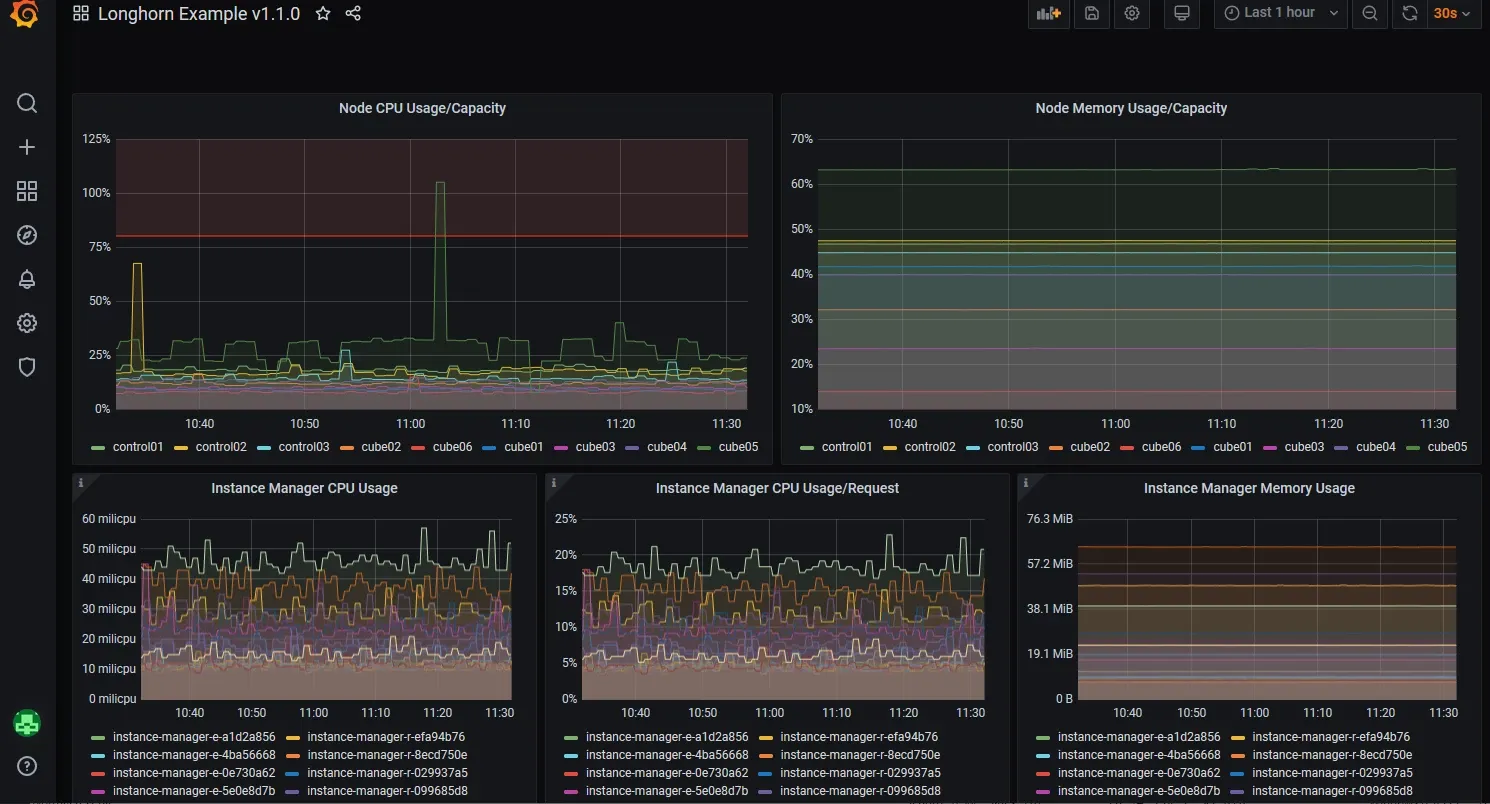
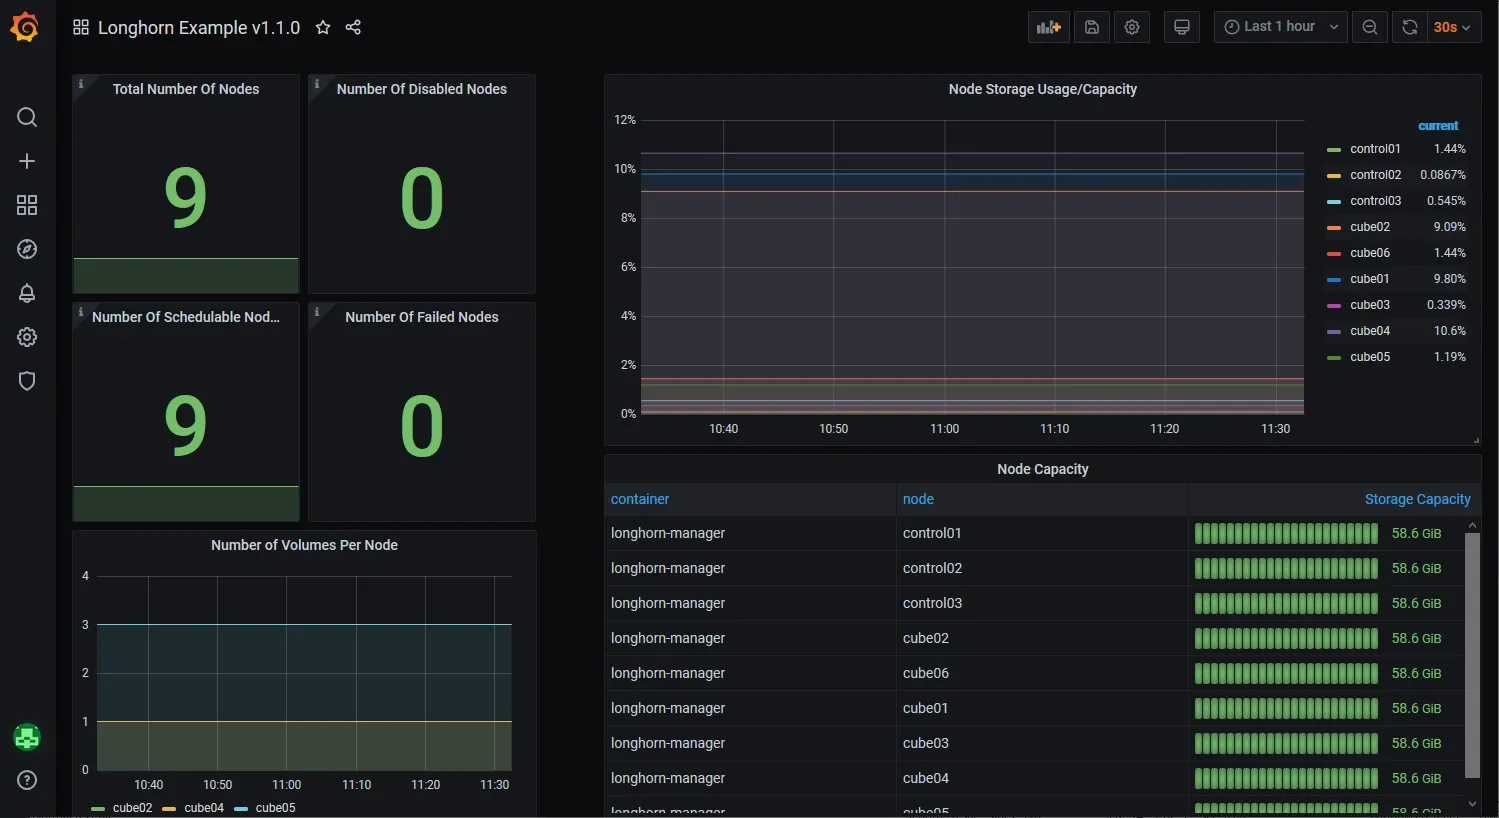
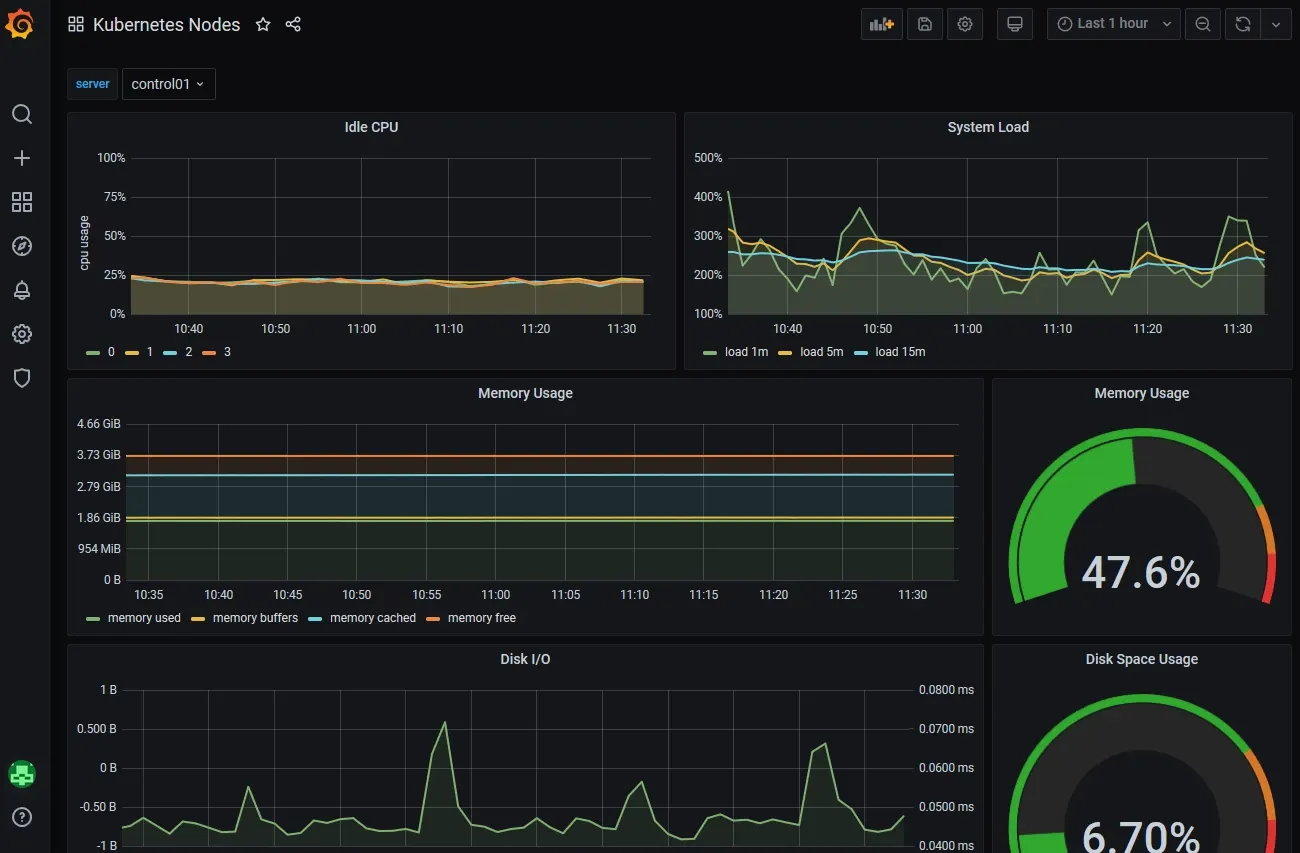
Here are some juicy pictures to keep you motivated:
Components
Whole monitoring is built from several components. I'll try to explain them as best and as simply as I can, so you don't get lost.
Prometheus Operator
This is a solo deployment. One instance that will help us provision Prometheus, and some of its components. It extends the Kubernetes API, so that when we create some YAML deployments it will look as if we’re telling Kubernetes to deploy something, but it’s actually telling Prometheus Operator to do it for us. Official git: Prometheus Operator
Prometheus
This is the collector of metrics, it uses something called service monitors that provide information Prometheus can come and scrape. Prometheus will use persistent storage, and we will specify for how long it will keep the data. You can have more than one instance of Prometheus in your cluster collecting separate data. Having multiple instances of Prometheus would ensure that if one died, it wouldn’t take the whole monitoring system with it. In our case we will have only two. One that comes with OpenFaaS if you followed my guide, and one we will deploy to collect monitoring data from everything else. This is mainly because Prometheus keeps its stuff in RAM, and that comes at a premium on Raspberry Pi 4.
Service Monitors
These are other containers/deployments. They are kind of middle steps between the data and Prometheus. We will deploy some that are a single deployment. For example, for Kubernetes API to collect metrics from a server, or a longhorn service monitor, it is also a single deployment. Then there is another kind of deployment: daemonset, which deploys containers to each node. node-exporter is using this kind of deployment, and that’s because it collects underlying OS information per node. Makes sense?
Grafana
Prometheus can do some graphing of data, it has its own web UI... However, Grafana is on another level. Grafana as its name suggests, makes graphs. Subtle I know 🙂. You can create custom dashboards, and display data collected by Prometheus. It can display data from multiple Prometheus instances, and combine them into a single dashboard, etc...
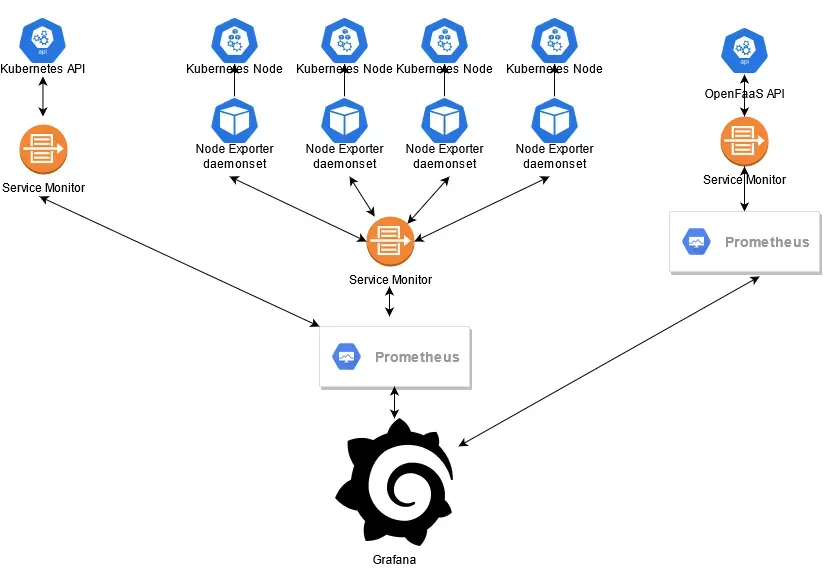
How is everything connected ?
This is a picture of how I think everything is connected in the deployment we are going to do.
Move on
Enough talk, let’s move on to deploying Prometheus Operator