Install Grafana
Deployment
Let’s deploy Grafana to read data from Prometheus instances.
This will be simple. In our monitoring directory, create a new subdirectory called grafana, and in it, we will create following files:
grafana-pvc.yaml
apiVersion: v1
kind: PersistentVolumeClaim
metadata:
  name: longhorn-grafana-pvc
  namespace: monitoring
spec:
  accessModes:
    - ReadWriteOnce
  storageClassName: longhorn
  resources:
    requests:
      storage: 10Gi
This will be our persistent storage, it’s to keep the dashboards saved. As far as I understand it, Grafana does not keep the data, so we don't have to have so much space dedicated to it (mine is using like 400 MB).
grafana-deployment.yaml
apiVersion: apps/v1
kind: Deployment
metadata:
  labels:
    app: grafana
  name: grafana
  namespace: monitoring
spec:
  replicas: 1
  selector:
    matchLabels:
      app: grafana
  template:
    metadata:
      labels:
        app: grafana
    spec:
      containers:
      - env: []
        image: grafana/grafana:latest
        name: grafana
        ports:
        - containerPort: 3000
          name: http
        readinessProbe:
          httpGet:
            path: /api/health
            port: http
        resources:
          limits:
            cpu: 200m
            memory: 200Mi
          requests:
            cpu: 100m
            memory: 100Mi
        volumeMounts:
        - mountPath: /var/lib/grafana
          name: grafana-storage
          readOnly: false
      nodeSelector:
        node-type: worker
      securityContext:
        fsGroup: 65534
        runAsNonRoot: true
        runAsUser: 65534
      serviceAccountName: grafana
      volumes:
        - name: grafana-storage
          persistentVolumeClaim:
            claimName: longhorn-grafana-pvc
Fairly standard deployment, I mentioned most of the "kinks" I use before, like nodeSelector etc...
grafana-serviceAccount.yaml
apiVersion: v1
kind: ServiceAccount
metadata:
  name: grafana
  namespace: monitoring
Just a service account for Grafana.
grafana-service.yaml
apiVersion: v1
kind: Service
metadata:
  name: grafana
  namespace: monitoring
spec:
  selector:
    app: grafana
  type: LoadBalancer
  ports:
  - name: http
    port: 3000
    targetPort: http
  loadBalancerIP: 192.168.0.206
Classic for us by now: I'm creating external IP for Grafana to run on 192.168.0.206, and port 3000.
Jump one folder up, and apply to the whole folder:
cd ..
kubectl apply -f grafana/
Check if Grafana pod is deployed:
root@control01:~/monitoring/grafana# kubectl get pods -n monitoring
NAME                                   READY   STATUS    RESTARTS   AGE
grafana-7784595599-rq8zg               1/1     Running   0          12d
.
.
.
Basic setup
You should be able to connect to the IP of Grafana now.
Default login and password is admin:admin
Then, go down and change your account name, password etc...

Next, we need to define the source where Grafana should look for data.
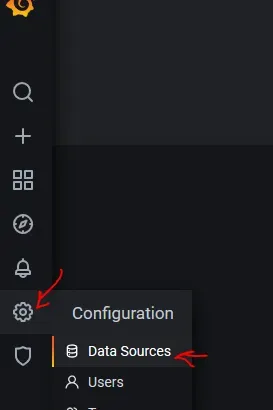
Click on Add data source and choose Prometheus, a new tab with settings will pop up. Set a name for your instance, for example Prometheus-main. This is so we can differentiate sources later. The next important value is URL. If you remember, back when we deployed the Prometheus file prometheus-service-local.yaml, we created ClusterIP, and in another file, MetalLB IP. You can choose any of them. To check look at the services:
root@control01:~/monitoring/grafana# kubectl get services -n monitoring
NAME                  TYPE           CLUSTER-IP      EXTERNAL-IP     PORT(S)             AGE
.
.
prometheus-external   LoadBalancer   10.43.167.23    192.168.0.205   9090:32545/TCP      12d
prometheus            ClusterIP      10.43.108.243   <none>          9090/TCP            12d
.
.
So, in the URL either put IP or NAME, so for example, using internal ClusterIP, entering http://10.43.108.243:9090 should work. You can also use prometheus-external:9090 or 192.168.0.205:9090.
At the bottom click Save & Test. It should check and save the data source.
Add another data source. This will be for OpenFaaS (if you have it). Same drill as above, just check your IP for OpenFaaS Prometheus.
root@control01:~/monitoring/grafana# kubectl get services -n openfaas
NAME                TYPE           CLUSTER-IP      EXTERNAL-IP     PORT(S)          AGE
.
.
prometheus          ClusterIP      10.43.98.240    <none>          9090/TCP         13d
So use 10.43.98.240:9090 for URL, and name it Prometheus-OpenFaaS, or something that will let you know it’s OpenFaaS data.
prometheus, therefore I opt for IP instead of http://prometheus:9090, as I'm not sure if the internal DNS would mess something up.Some Graphs
My final goal is to create my own dashboard with data I want. But before we get to that, we can use an already existing collection (and later pick and choose what we want from them).
Click on the plus sign and then Import:
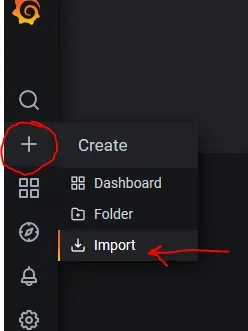
Next, type 8171 into Import via grafana.com.
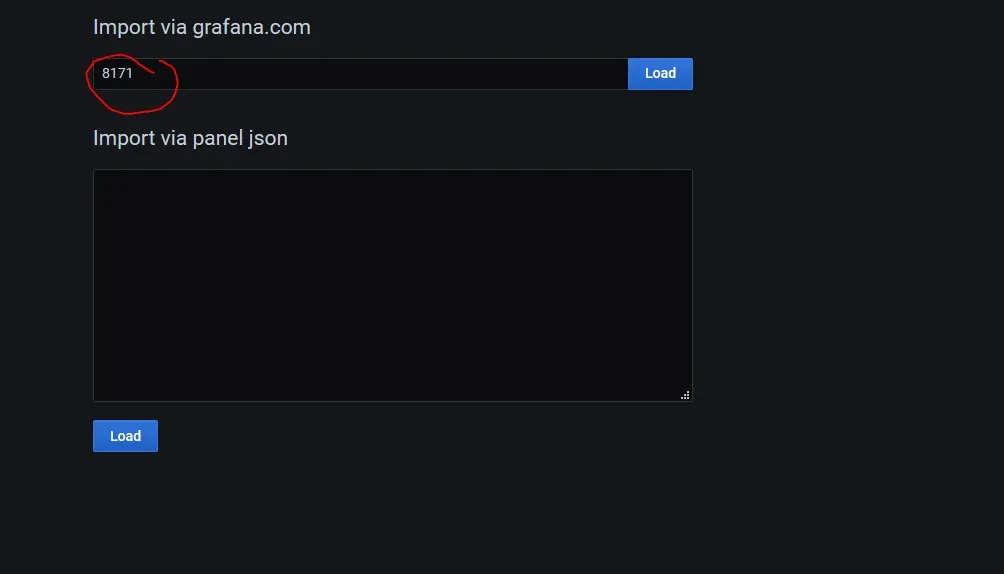
Where did I get the ID? Well, here: Grafana Dashboard.
Click Load.
In the next window, name the dashboard if you like, but more importantly, choose the source for your main Prometheus instance.
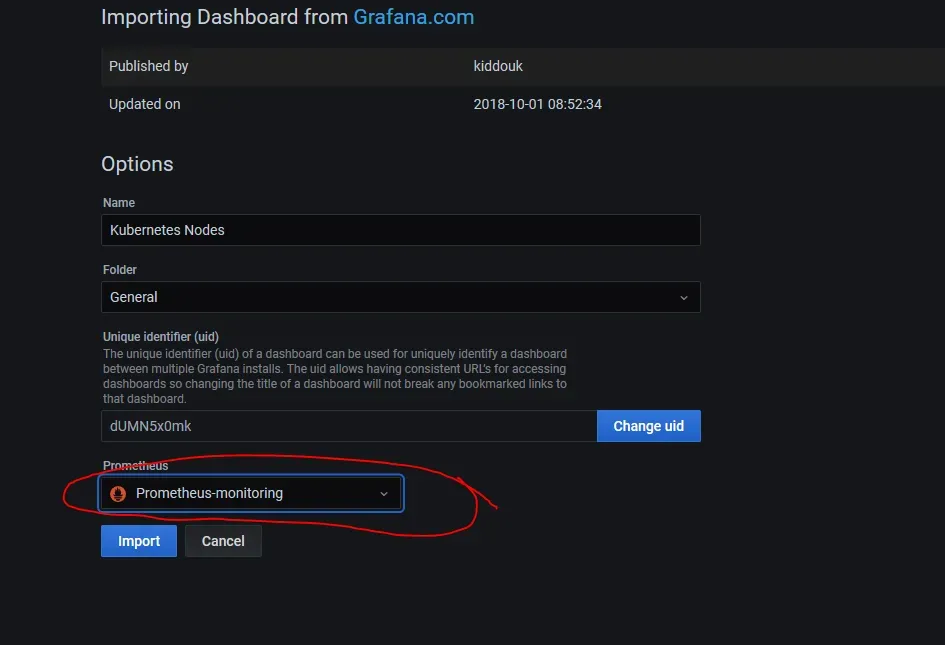
Click Import.
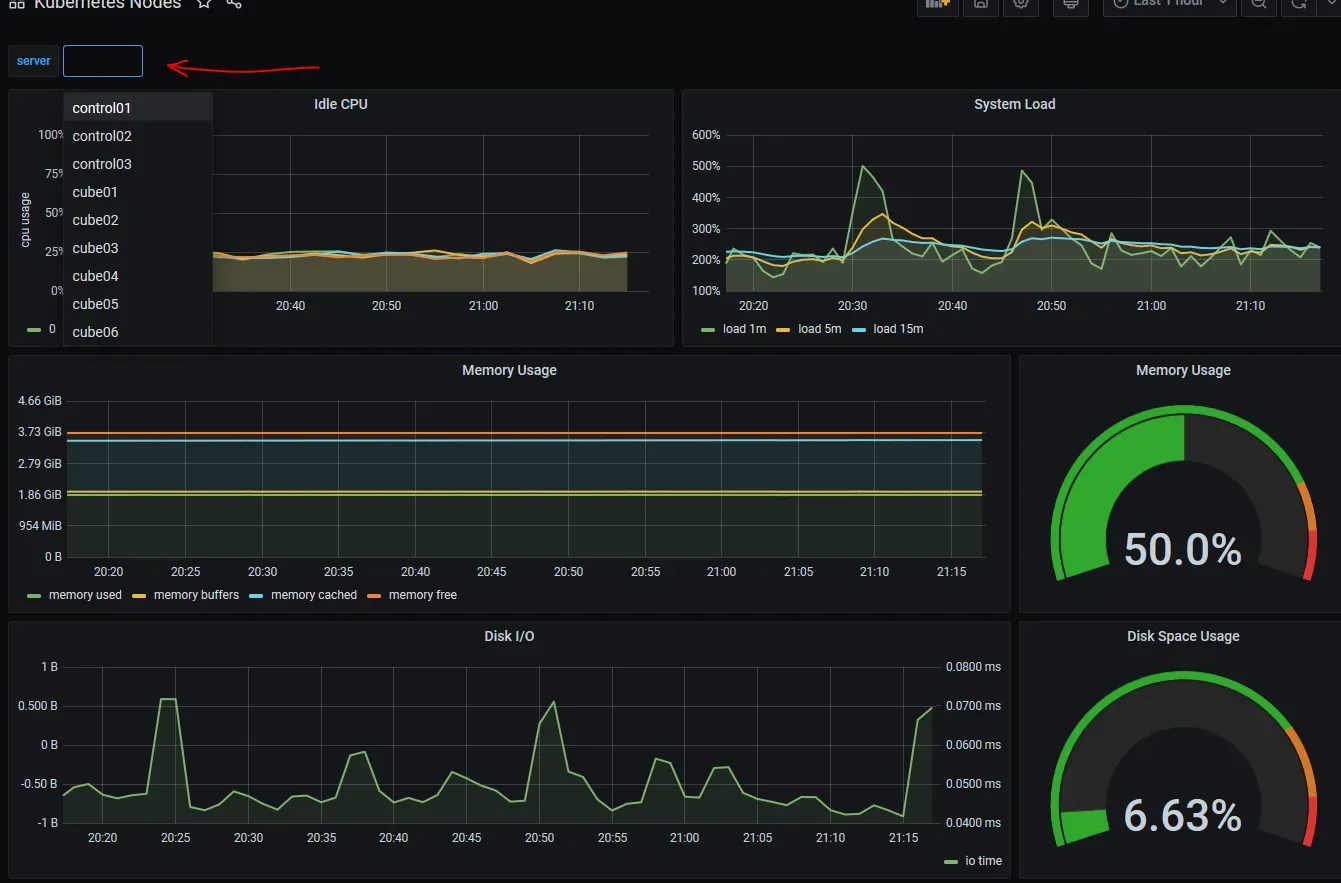
Tadaaaa! Your first graphs. It should take you to them immediately, and you can choose data from a specific server on the top.
Here is a list of other dashboards that work, mostly, out of the box.
And that’s really it. In the next chapter, we are going to add logging of logs to Grafana. Logging