Logging Logs
Loki
We have our Prometheus and Grafana on k3s cluster if you followed my guides. But Prometheus is not able to get logs from k3s nodes, containers, Kubernetes API, and it's not made of that kind of monitoring. We need Loki + Promtail, you can find all info on their Grafana Loki and Promtail.
- Loki - or also known as Grafana Loki - log aggregation system, it does not index the contents of the logs, but rather a set of labels for each log stream. In simple terms, it's the app that accepts logs from everything and store it.
- Promtail - is a tool that reads the logs from various sources like OS, Containers, Kubernetes API server etc... and push them to Loki.
Installation
I'm going to use the most simple and easy way to install Loki and Promtail. We should have Arkade ready from my tutorials here. Arkade already support this kind of installation, and we can leverage it (also supports arm64 natively).
First create namespace for Loki and Promtail:
kubectl create namespace loggingNext install Loki and Promtail:
## Adding --persistence, Loki will claim 10 GB of persistent storage for its data.
root@control01:~# arkade install loki -n logging  --persistence
After its done, check if all pods are running:
kubectl get pods -n loggingIt should look like this in the end:
root@control01:~# kubectl get pods -n logging
NAME                        READY   STATUS    RESTARTS   AGE
loki-stack-promtail-cvm5n   1/1     Running   0          2m31s
loki-stack-promtail-phnhd   1/1     Running   0          2m31s
loki-stack-promtail-ttdm9   1/1     Running   0          2m31s
loki-stack-promtail-vvmwv   1/1     Running   0          2m31s
loki-stack-promtail-5kmd5   1/1     Running   0          2m31s
loki-stack-promtail-n7tnf   1/1     Running   0          2m31s
loki-stack-0                1/1     Running   0          2m31s
loki-stack-promtail-wp2hj   1/1     Running   0          2m31s
You see there is loki-stack-promtail-xxxx running on all nodes. This is Promtail DaemonSet, it will scale up and down automatically based on the number of nodes. It does not go to master node though.
You can see its setting like this:
kubectl get daemonsets loki-stack-promtail -n logging -o jsonI'm currently unsure if its good idea to have it running on master nodes, because it by default excluded it. You can see that config here:
.
.
.
                "tolerations": [
                    {
                        "effect": "NoSchedule",
                        "key": "node-role.kubernetes.io/master",
                        "operator": "Exists"
                    },
                    {
                        "effect": "NoSchedule",
                        "key": "node-role.kubernetes.io/control-plane",
                        "operator": "Exists"
                    }
                ],
.
.
.
On other hand, we would like to collect logs from all nodes, right?
Patching configuration
We are going to patch existing configuration to enable Promtail to collect logs from all nodes. I think I never mentioned this method before, but It's not hard to do.
The command we are going to use is kubectl patch. I prefer to create a yaml file with change I want to make, instead of writing it to the patch command single line, so I can easily see what I am doing.
Let's change the current setting for tollerations to include all nodes:
cd
mkdir logging
cd logging
nano patch.yaml
Content of the patch.yaml file:
spec:
  template:
    spec:
      tolerations:
        - operator: Exists
Apply the patch:
root@control01:~/logging# kubectl patch daemonset loki-stack-promtail -n logging --patch "$(cat patch.yml)"
daemonset.apps/loki-stack-promtail patched
Now we can check if the pod is running on all nodes:
root@control01:~/logging# kubectl get pods -n logging
NAME                        READY   STATUS    RESTARTS   AGE
loki-stack-0                1/1     Running   0          83m
loki-stack-promtail-dps8w   1/1     Running   0          6m33s
loki-stack-promtail-qgmln   1/1     Running   0          5m32s
loki-stack-promtail-rjsfg   1/1     Running   0          5m20s
loki-stack-promtail-m4rwz   1/1     Running   0          4m59s
loki-stack-promtail-2778n   1/1     Running   0          4m35s
loki-stack-promtail-zm5fr   1/1     Running   0          4m13s
loki-stack-promtail-p5dgq   1/1     Running   0          3m52s
loki-stack-promtail-w9rx4   1/1     Running   0          3m30s
I have 8 nodes in total, so as expected we can see loki-stack-promtail-XXXX running 8 times (might take some time and restarts before it will run).
Show me some Logs
Above is all well and nice, but where are my logs? I was promised nice UI for logs and so far CLI galore. No worries my friends, this part will take care of it.
You should have installed and setup Grafana as I had in my guide, simple reason, we are going to use Grafana to view the logs.
Before we go and log into our Grafana we need to find IP of our loki-stack run following command:
root@control01:~/logging# kubectl get svc -n logging
NAME                  TYPE        CLUSTER-IP     EXTERNAL-IP   PORT(S)    AGE
loki-stack-headless   ClusterIP   None           <none>        3100/TCP   12m
loki-stack            ClusterIP   10.43.16.221   <none>        3100/TCP   12m
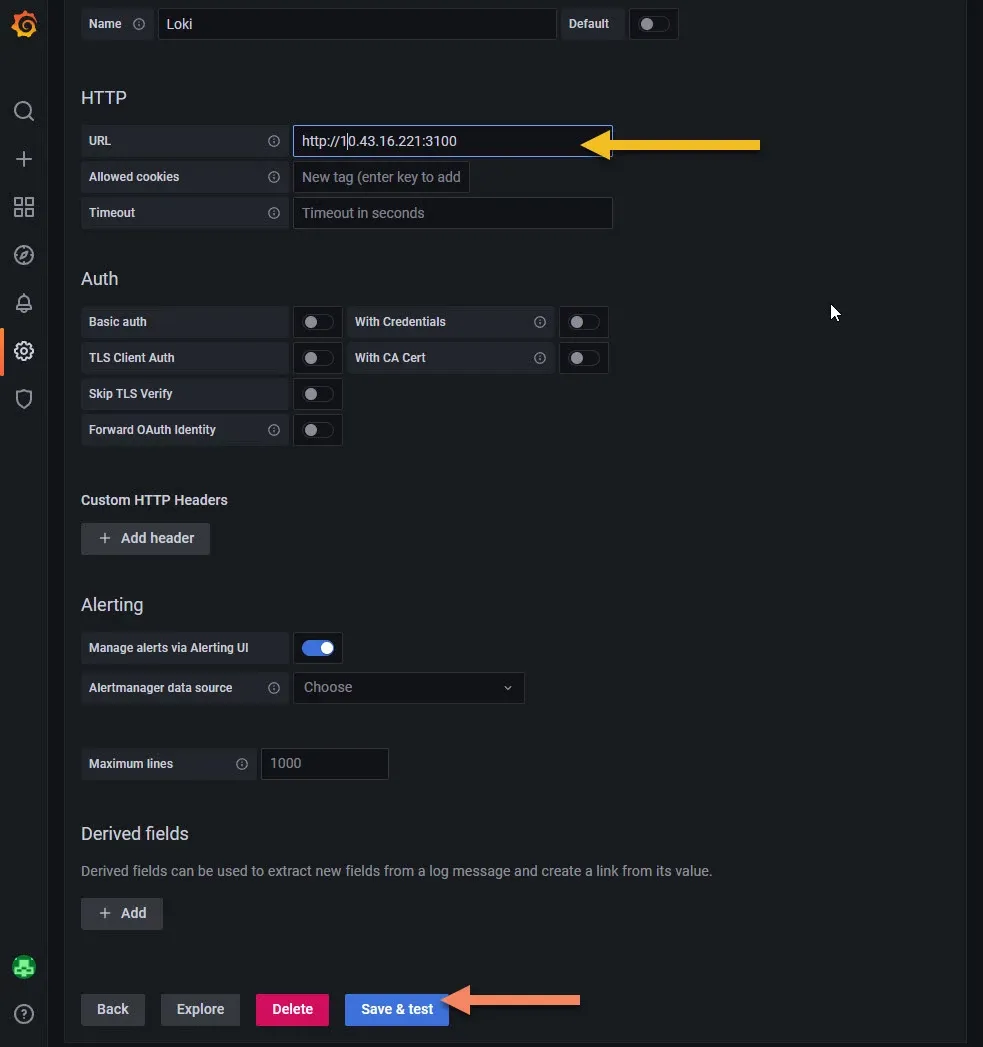
This line is what you need: loki-stack ClusterIP 10.43.16.221, mark the IP somewhere, we are going to need it in Grafana.
Grafana
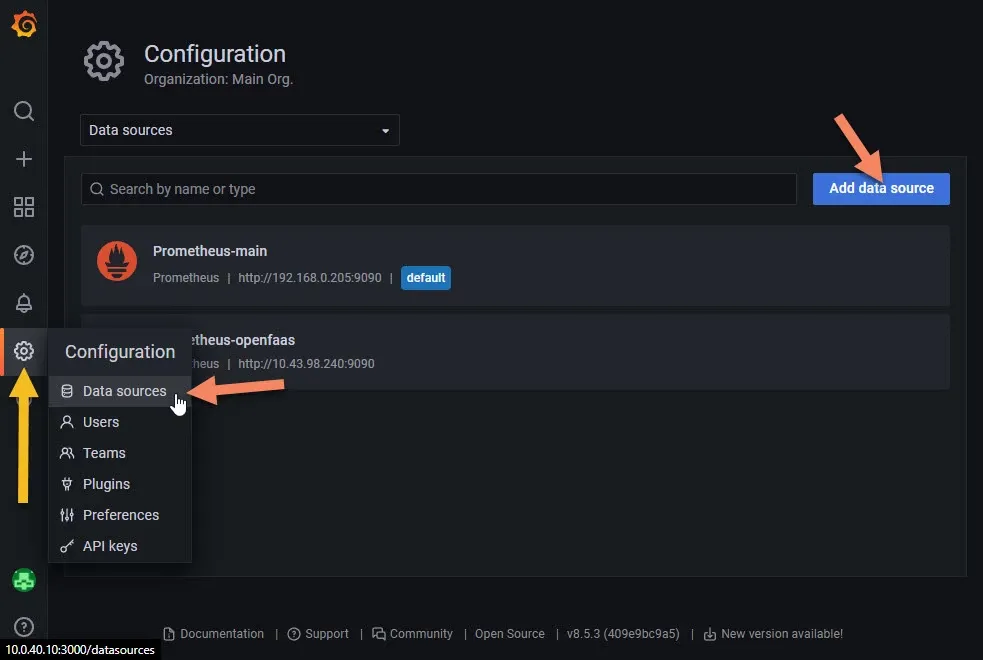
Log in and head to the Configuration -> Data Sources -> Add Data Source page.
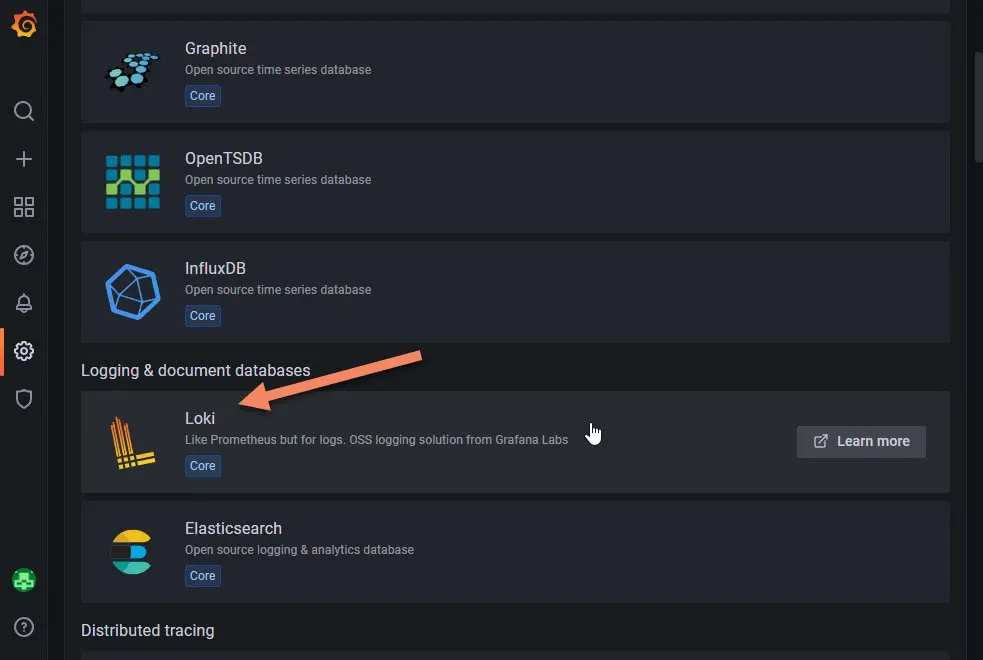
Scroll down to the Loki section and click on it.
In the next page you only need to add the IP we got from the previous step. Then down click Save & Test button.
Logs
You can explore the logs directly by clicking on the Explore button.
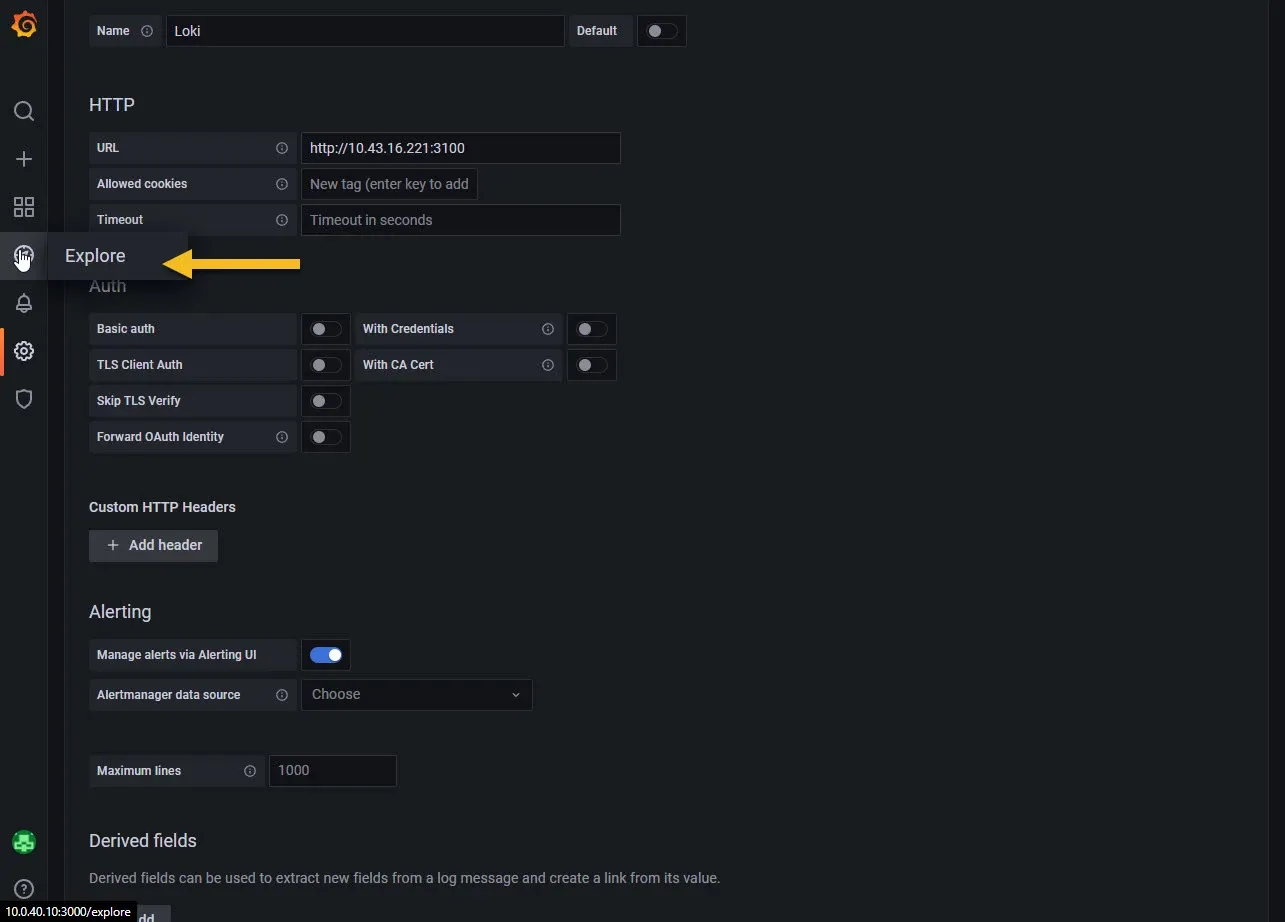
Then on the top choose Loki as source, click on Log browser and choose anything you like to see logs from. You can combine multiple selections. For example selecting node_name and pod will filter out pods running on specific node... etc.
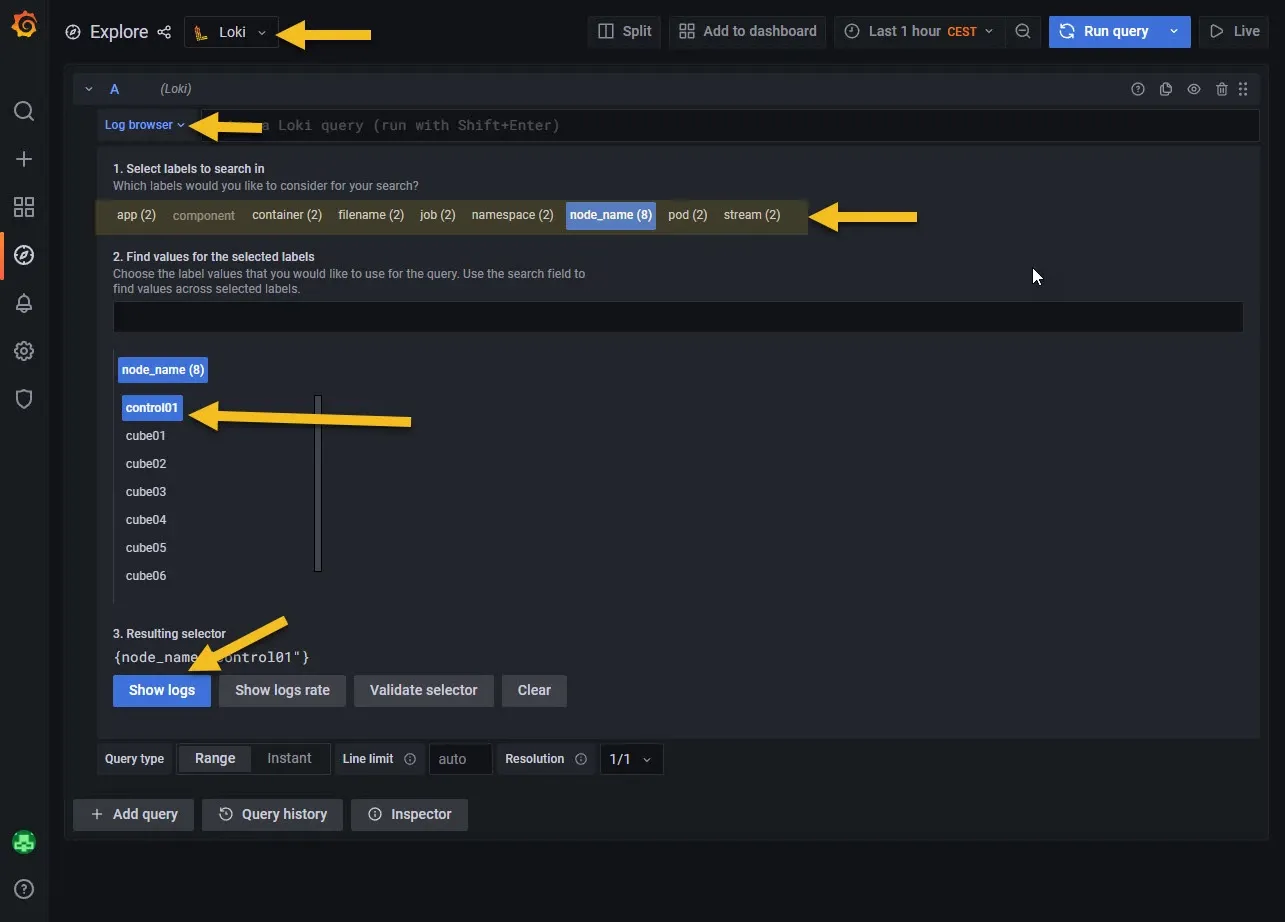
Click on Show Logs button.
Grafana Dashboards
I have found few nice working dashboards for Loki in Grafana. We can add them by clicking on + sign on the left panel -> import button.
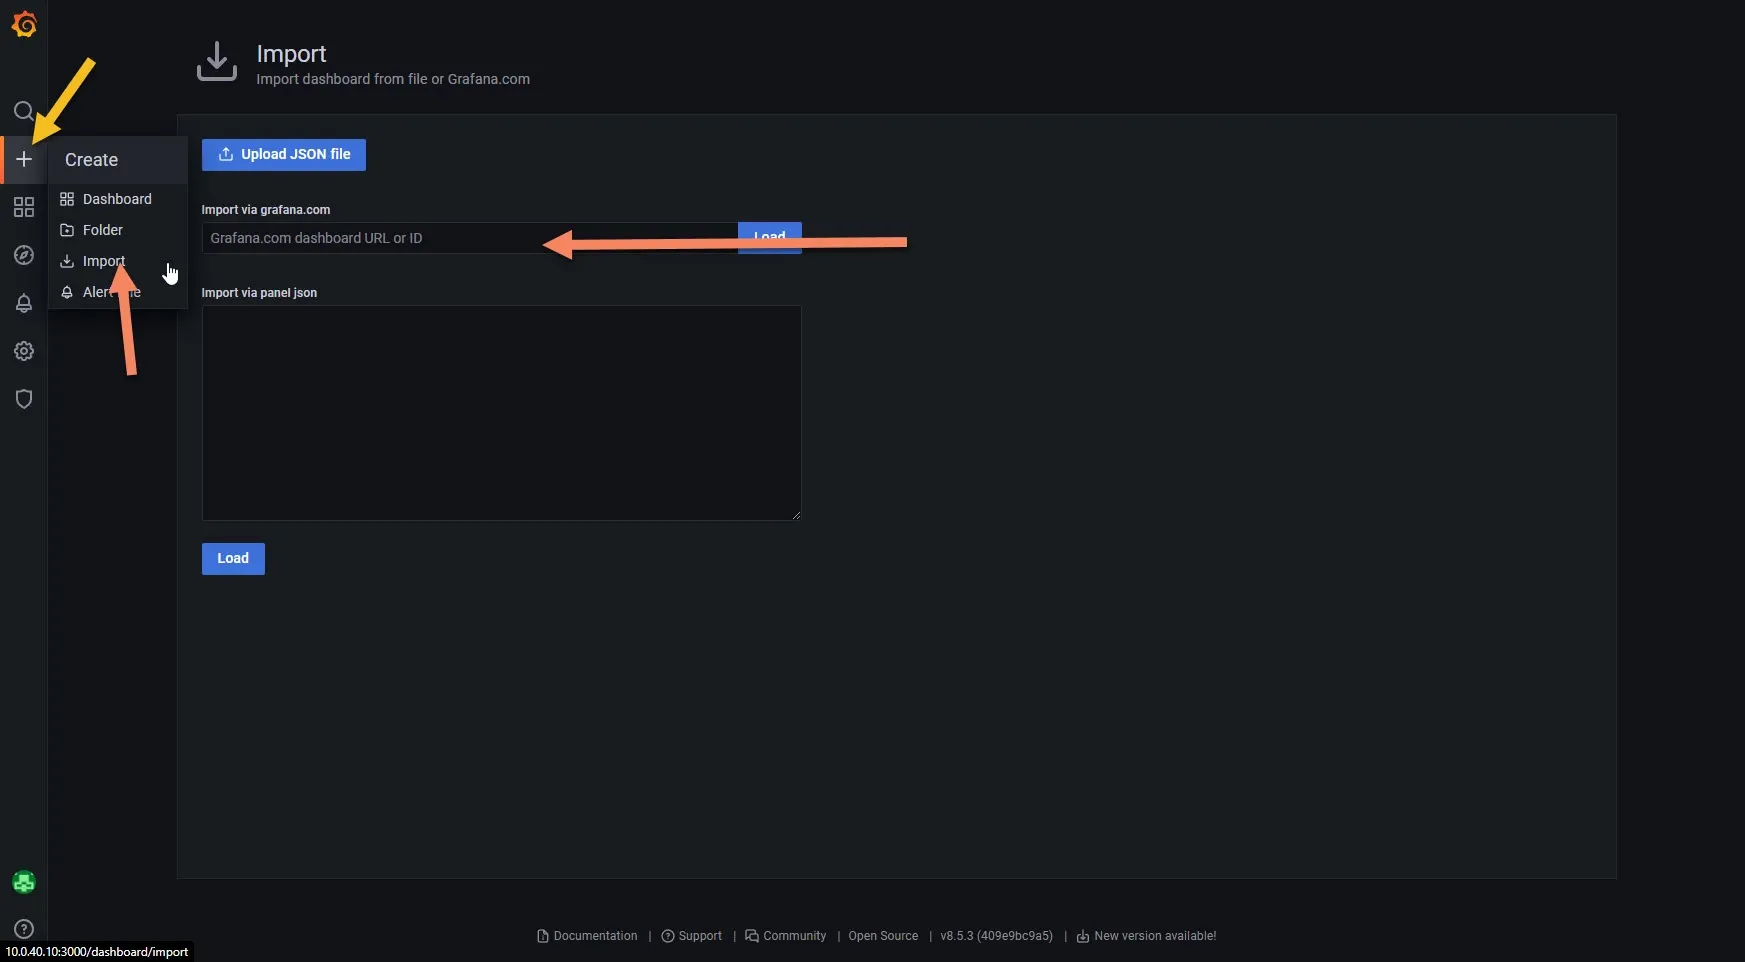
You can add ID of the dashboard you want to import into Import via grafana.com field.
For some Loki dashboards you can look here.
Loki as datasource at the bottom of the page when importing dashboards.I have used these:
13639 - Loki Logs
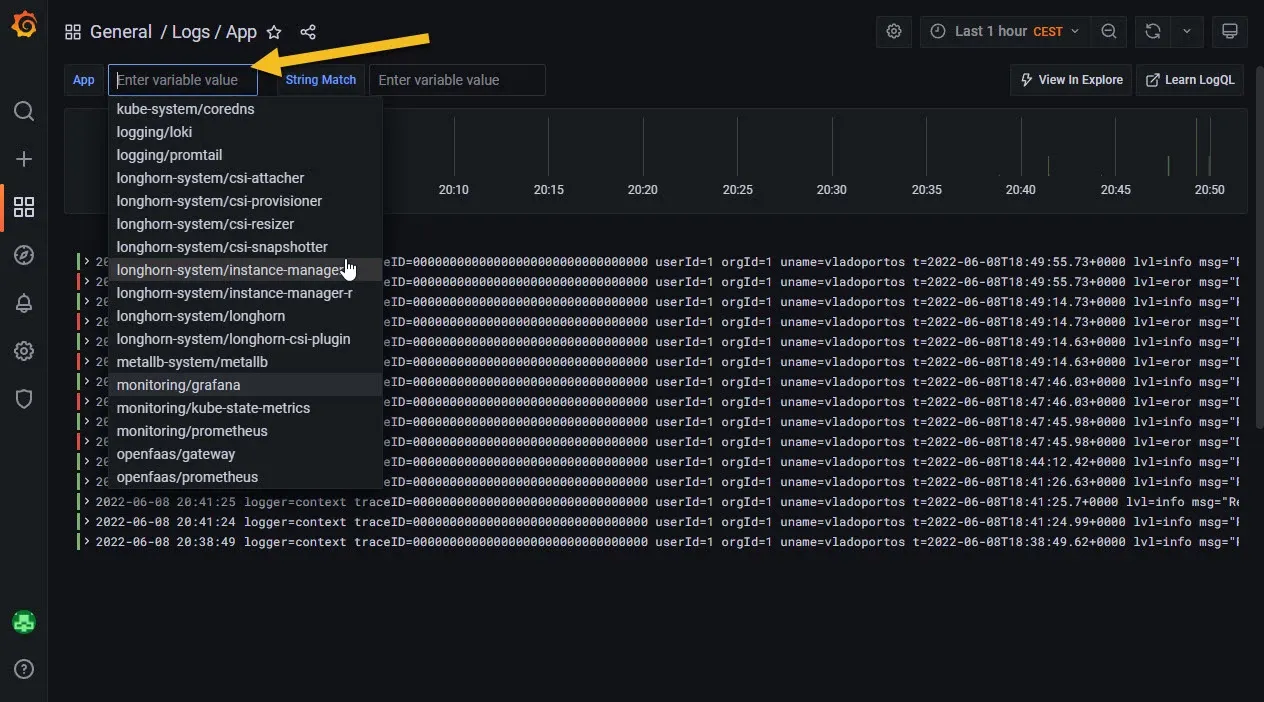
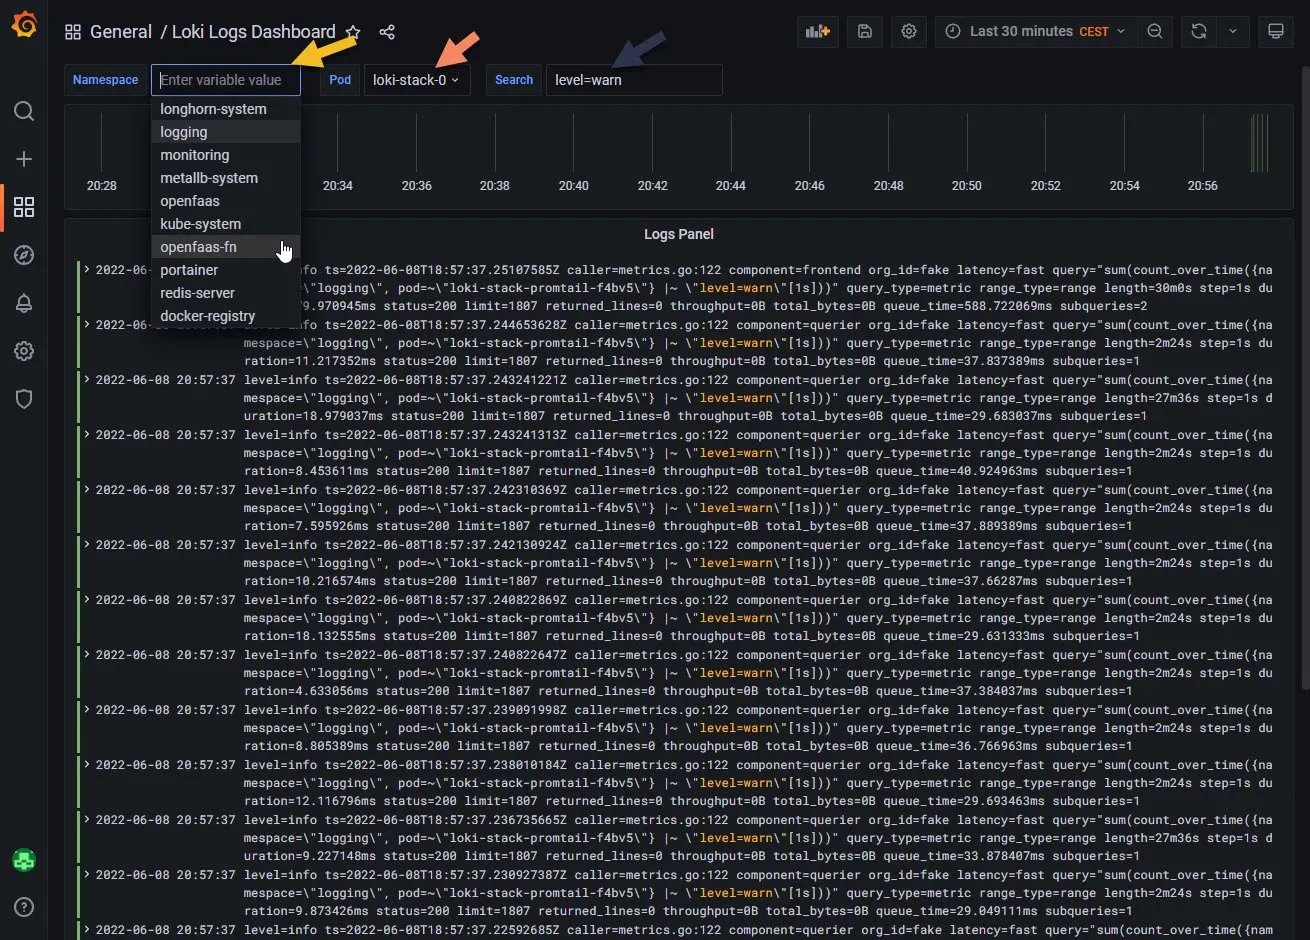
15324 - Loki Logs Dashboard
What about OS logs / Syslog?
There is a way to use syslog-ng to send data to Loki via Promtail, but the way I have installed DietPi we actually don't have syslog-ng installed and OS logs are logged to RAM and deleted after one hour. This was to save wear on the SD card/USB drive. You should treat your cluster nodes as "disposable" if something is not ok, remove and reinstall it. If something is wrong with application we got that covered.
There is also way to read journal logs, but I did not test it yet. These logs are in /var/log/run/journal/
But if somebody really wants to log OS logs, he/she can leave a comment and I will add it to the documentation.
Promtail and Loki Config Files
You can find and dump to YAML config files for Promtail and Loki in following way:
#Loki
kubectl get secrets/loki-stack -n logging -o "jsonpath={.data['loki\.yaml']}" | base64 --decode > loki.yaml
#Promtail
kubectl get secrets/loki-stack-promtail -n logging -o "jsonpath={.data['promtail\.yaml']}" | base64 --decode > promtail.yaml
As you can see they are hidden as "secrets" in the cluster. You can change them if you know what you are doing.
Then apply the config files:
kubectl create secret -n logging generic loki-stack --from-file=loki.yaml --dry-run=client -o yaml | kubectl apply -f -
#or
kubectl create secret -n logging generic loki-stack-promtail --from-file=promtail.yaml --dry-run=client -o yaml | kubectl apply -f -
Cleanup
If you want to get rid of the Loki stack, you can remove it with following command:
helm delete -n logging loki-stackFinal thoughts
Cool right ? Logs into your nice Kubernetes application. I hope you will find this useful. Get some coffee and let me know if you have any questions down in comments. Or you can get one coffee for me as well.